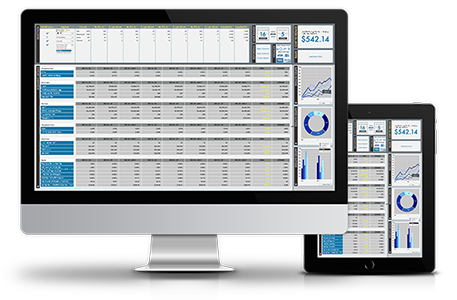
This is another financial services application I designed for my client's predictive analytics service. Many accounting applications are heavily table-based by design, and this is a useful way of looking at the data, but it's also necessary to communicate that completixty with others who aren't "down in the weeds," as it were.
So giving users access to graphical alternatives to their display choices is extremely important, especially if they need to hand off their detailed analysis to others. Therefore, you want to allow for both in your design – output to graphics which can help summarize your conclusions for executive presentations and the like, and also enable users to "deep dive" into the complexity of tabled data as needed.
In this case, I solve the UI challenge of displaying additional data without also gobbling up additional screen real estate, through the use of shelving. The main page is a tabled display that allows for detailed work, but has a customizable graphics shelf on the right-hand side, which can be shown or dismissed, via a vertical slider. Various types of graphs are available for selection from the top menu panel, and once loaded to the shelf, each graph can be customized to show a particular range of data. Users can then elect to output a combination of the two to a report for distribution elsewhere in their company.